Unraveling the Cryptocurrency Market: How Pivot Points and Price Action Led to 6204%+ Profit in Backtesting using Freqtrade
Here is the 4th edition of the famous article on building PROFITABLE TRADING STRATEGY. (New Strategy)
1st Edition: “Unlock 4450% Profit with Algorithm Trading on Cryptocurrency: A Freqtrade Case Study” — Link
2nd Edition: “2509% Profit Unlocked: A Case Study on Algorithmic Trading with Freqtrade” — LINK
3rd Edition: “Unleashing the Power: Unveiling a 10,000%+ Profit Surge in 2.5 Years with Advanced Cryptocurrency Algorithmic Trading Using Freqtrade” — LINK
In the world of cryptocurrency trading, developing an effective algorithmic trading strategy can greatly enhance the potential for success. In this article, we will explore the backtested results of a trading algorithm that illustrates the use of basic but most powerful Price Action method using Pivot Points to identify Support and Resistance levels and then take Long and Short Positions when reversal happens from the price point. The algorithm was implemented using Freqtrade, a popular open-source cryptocurrency trading bot.
We have covered lot of introductory topics in the 1st edition which covers all key basic concepts which I mentioned below, if you are new to “trading”, “algorithm trading”, “freqtrade” platform or “futures trading” concepts, I suggest you to open my previous articles and go through the same.
I’m here to talk about my new strategy which I was working for past few months
Topics covered in 1st edition: (Link)
Introduction to algorithmic trading and its benefits
What algorithmic trading is and how it can be used in the context of crypto futures trading
Some of the benefits of using algorithmic trading for crypto futures include:
Introduction to the freqtrade platform
Here are some key features of the freqtrade platform:
What is Short Trading and Long Trading in Futures Market
How Leverage works and Factors to consider while using Leverage during Trades
There are a few factors that traders should consider when deciding whether and how to use leverage:
- Risk appetite: Traders with a higher risk appetite may be more comfortable using larger amounts of leverage, while those who are more risk-averse may prefer to use less leverage or none at all.
- Trading strategy: Different trading strategies may be more or less suitable for leveraging, depending on the level of risk involved and the trader’s goals.
- Market conditions: The level of leverage that is appropriate for a trade may also depend on the current market conditions, such as the level of volatility or the overall trend of the market.
- Trading capital: Traders should also consider their available capital when deciding how much leverage to use, as they will need to have sufficient margin to cover any potential losses.
In general, it’s important for traders to carefully evaluate the potential risks and rewards of using leverage and to use it responsibly, as it can significantly impact the outcome of a trade.
Setting up freqtrade for crypto futures trading
- There are lot of tutorials about how to connect Freqtrade using docker in a containerized environment. You can refer to any of the many Youtube tutorials on the same.
- Here, Our main agenda is to show case the backtest and forward test results of the algorithm trading on freqtrade, so, I will focus on that more.
- If there is a lot of demand and requests in comments for a tutorial on how to setup freqtrade and run your own strategies if requested, I will add that in forth coming article. Thank you
Resources:
or
or
I’m giving reference only.
Introduction
Concept of price action trading and its importance in the crypto market.
Price action trading is a trading strategy that involves analyzing and making trading decisions based on the actual price movements of an asset, rather than relying on indicators or oscillators. It focuses on studying historical price data, chart patterns, and market behavior to forecast future price movements.
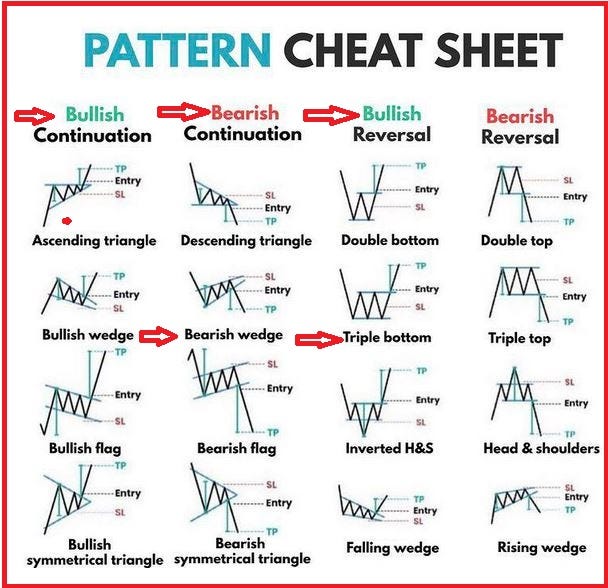
In price action trading, traders look for patterns and formations on price charts, such as support and resistance levels, trendlines, candlestick patterns, and chart patterns like head and shoulders, double tops, and triangles. These patterns can provide valuable insights into the sentiment and behavior of market participants.
The importance of price action trading in the crypto market lies in its ability to provide a clear and uncluttered view of the market dynamics.

It helps traders to:
Identify Trends: Price action analysis can help identify trends, whether they are uptrends, downtrends, or sideways trends, enabling traders to take advantage of market direction.
Spot Support and Resistance Levels: By recognizing support and resistance levels, traders can make informed decisions on when to enter or exit a trade.
Predict Price Reversals: Price action patterns often signal potential price reversals, giving traders opportunities to profit from trend changes.
Improve Market Timing: Price action trading helps traders to time their trades better and avoid entering the market during periods of uncertainty or low volatility.
Avoid Lagging Indicators: Price action trading eliminates the reliance on lagging indicators, offering a more real-time and dynamic approach to trading.
In the fast-paced and volatile crypto market, price action trading provides traders with a straightforward and effective method to navigate price fluctuations and make well-informed trading decisions. It allows traders to react quickly to market changes and adapt their strategies based on the latest price movements, making it an essential tool for crypto traders.
Understanding Price Action
Price action and how it represents the movement of an asset’s price over time.
Price action refers to the study and analysis of an asset’s price movement on a price chart over a specific period. It involves observing and interpreting the patterns, formations, and behavior of the asset’s price without the use of traditional indicators or oscillators.
Price action is based on the premise that all relevant market information is reflected in the asset’s price, and by analyzing the historical price data, traders can gain insights into the market sentiment and the balance of supply and demand. It helps traders understand the underlying dynamics of the market, identify trends, spot key support and resistance levels, and anticipate potential price reversals.
The representation of an asset’s price movement over time is visualized on a price chart, typically using candlestick charts, line charts, or bar charts. Each data point on the chart represents the price at a specific time interval, such as minutes, hours, days, or weeks, depending on the chosen timeframe.
Candlestick charts are the most commonly used type in price action analysis. Each candlestick represents the open, high, low, and close prices for a specific time period. The body of the candlestick represents the price range between the open and close, while the wicks (shadows) represent the highest and lowest prices during that period.
By analyzing patterns formed by candlesticks, such as doji, hammers, engulfing patterns, etc., traders can identify potential price reversals or continuation signals. Price action analysis also involves observing key levels of support and resistance, trendlines, and chart patterns, which can provide valuable insights into market behavior.
In summary, price action represents the movement of an asset’s price over time, and through careful analysis of historical price data, traders can gain valuable information to make informed trading decisions without relying on lagging indicators or complex mathematical formulas. It is a fundamental approach to understanding market dynamics and plays a crucial role in various trading strategies and decision-making processes.
Analyzing price action and identifying patterns is of paramount importance in trading for the following reasons:
- Clear Market Signals: Price action analysis provides clear and unambiguous signals on the price chart. By identifying patterns and formations, traders can quickly interpret market sentiment and make informed trading decisions.
- Real-time Market Information: Price action analysis provides real-time market information. Traders can see the immediate reaction of market participants and adjust their strategies accordingly.
- No Lagging Indicators: Unlike traditional technical indicators that rely on past price data, price action analysis is based on current price movements. It eliminates the lag often associated with indicators, making it more responsive to changes in market conditions.
- Trend Identification: Price action helps in recognizing trends, whether they are uptrends, downtrends, or sideways trends. This enables traders to align their positions with the prevailing market direction, increasing the likelihood of profitable trades.
- Support and Resistance Levels: Price action analysis allows traders to identify key support and resistance levels, which act as potential entry and exit points. These levels are significant as they represent zones where the market is likely to react.
- Candlestick Patterns: Candlestick patterns provide valuable information about the psychology of market participants. Patterns like doji, hammers, and engulfing patterns can signal potential trend reversals or continuation of the current trend.
- Chart Patterns: Price action analysis helps in recognizing chart patterns like head and shoulders, double tops, triangles, etc. These patterns can provide insights into potential breakout or breakdown scenarios.
- Risk Management: By analyzing price action, traders can set appropriate stop-loss levels based on support and resistance or volatility. This helps in managing risk and preserving capital.
- Entry and Exit Signals: Price action provides clear entry and exit signals. Traders can execute trades based on the formation of specific patterns or when price breaks key support/resistance levels.
- Versatility: Price action analysis can be applied to various timeframes, from short-term intraday trading to long-term investing, making it a versatile approach suitable for different trading styles.
- Reduced Noise: Price action analysis focuses on the most critical aspect of trading — price. By eliminating unnecessary indicators and noise, traders can focus on the core information affecting the asset’s price.
In conclusion, analyzing price action and identifying patterns is a valuable skill for traders as it provides clear and actionable information. It helps traders make better trading decisions, improves timing, and enhances risk management, ultimately increasing the probability of successful trades and achieving consistent profitability in the market.
Coding the Concept:
Python code:
# ATR
dataframe[‘atr’] = ta.ATR(dataframe, timeperiod=self.atr_period.value)
# pivot
dataframe[‘pivot’] = (dataframe[‘low’].rolling(self.timeperiod_check.value).mean().shift(1)+dataframe[‘high’].rolling(self.timeperiod_check.value).mean().shift(1)+dataframe[‘close’].rolling(self.timeperiod_check.value).mean().shift(1))/3
# Calculate the support levels using the CPR indicator
dataframe[‘Support1’] = dataframe[‘pivot’] — (dataframe[‘high’].rolling(self.timeperiod_check.value).mean().shift(1) — dataframe[‘pivot’])
dataframe[‘Support2’] = dataframe[‘pivot’] — 2 * (dataframe[‘high’].rolling(self.timeperiod_check.value).mean().shift(1) — dataframe[‘pivot’])
dataframe[‘Support3’] = dataframe[‘pivot’] — 3 * (dataframe[‘high’].rolling(self.timeperiod_check.value).mean().shift(1) — dataframe[‘pivot’])
dataframe[‘Support4’] = dataframe[‘pivot’] — 4 * (dataframe[‘high’].rolling(self.timeperiod_check.value).mean().shift(1) — dataframe[‘pivot’])
dataframe[‘Support5’] = dataframe[‘pivot’] — 5 * (dataframe[‘high’].rolling(self.timeperiod_check.value).mean().shift(1) — dataframe[‘pivot’])
# Calculate the resistance levels using the CPR indicator
dataframe[‘Resistance1’] = dataframe[‘pivot’] + (dataframe[‘pivot’] — dataframe[‘low’].rolling(self.timeperiod_check.value).mean().shift(1))
dataframe[‘Resistance2’] = dataframe[‘pivot’] + 2 * (dataframe[‘pivot’] — dataframe[‘low’].rolling(self.timeperiod_check.value).mean().shift(1))
dataframe[‘Resistance3’] = dataframe[‘pivot’] + 3 * (dataframe[‘pivot’] — dataframe[‘low’].rolling(self.timeperiod_check.value).mean().shift(1))
dataframe[‘Resistance4’] = dataframe[‘pivot’] + 4 * (dataframe[‘pivot’] — dataframe[‘low’].rolling(self.timeperiod_check.value).mean().shift(1))
dataframe[‘Resistance5’] = dataframe[‘pivot’] + 5 * (dataframe[‘pivot’] — dataframe[‘low’].rolling(self.timeperiod_check.value).mean().shift(1))
# stoploss and take profit for long and short
dataframe[‘sl_s’] = dataframe[‘open’] + (dataframe[‘atr’]*self.sl_s_period.value)
dataframe[‘tp_s’] = dataframe[‘open’] — (dataframe[‘atr’]*self.tp_s_period.value)
dataframe[‘sl_l’] = dataframe[‘open’] — (dataframe[‘atr’]*self.sl_l_period.value)
dataframe[‘tp_l’] = dataframe[‘open’] + (dataframe[‘atr’]*self.tp_l_period.value)
let’s explain the code point by point:
1. ATR (Average True Range):
— The code calculates the Average True Range (ATR) using the `ta.ATR` function, which measures the volatility of the asset over a specified period.
— ATR is commonly used to determine the stop loss and take profit levels based on the asset’s volatility.
2. Pivot:
— The code calculates the pivot point, which is the average of the previous day’s high, low, and close prices, using rolling mean functions.
3. Support Levels:
— The code calculates support levels (Support1 to Support5) using the Camarilla Pivot Range (CPR) indicator.
— Support1 is calculated by subtracting the difference between the pivot and the rolling mean of the previous day’s high from the pivot.
— Support2 to Support5 are calculated by multiplying the difference between the pivot and the rolling mean of the previous day’s high by 2 to 5, respectively, and subtracting from the pivot.
4. Resistance Levels:
— The code calculates resistance levels (Resistance1 to Resistance5) using the CPR indicator.
— Resistance1 is calculated by adding the difference between the pivot and the rolling mean of the previous day’s low to the pivot.
— Resistance2 to Resistance5 are calculated by multiplying the difference between the pivot and the rolling mean of the previous day’s low by 2 to 5, respectively, and adding to the pivot.
5. Stop Loss and Take Profit:
— The code calculates stop loss (sl) and take profit (tp) levels for both long and short trades based on ATR.
— For short trades, the stop loss (sl_s) is set above the open price by a multiple of the ATR, and the take profit (tp_s) is set below the open price by a multiple of the ATR.
— For long trades, the stop loss (sl_l) is set below the open price by a multiple of the ATR, and the take profit (tp_l) is set above the open price by a multiple of the ATR.
The code essentially computes various support and resistance levels along with stop loss and take profit levels for long and short trades using the ATR and pivot points. These levels can be used to make trading decisions and manage risk in the crypto market.
Pivot Points and Their Role in Trading
Pivot points are a popular technical analysis tool used by traders to identify potential support and resistance levels in the market. They are calculated based on the previous day’s price data and act as key reference points for traders to make trading decisions.
The calculation of pivot points involves four levels:
Pivot Point (PP):
- The pivot point itself is the average of the previous day’s high, low, and close prices.
- PP = (Previous Day’s High + Previous Day’s Low + Previous Day’s Close) / 3
Resistance Level 1 (R1) and Support Level 1 (S1):
- The first resistance level (R1) is calculated by multiplying the pivot point by 2 and subtracting the previous day’s low.
- R1 = (2 * PP) — Previous Day’s Low
- The first support level (S1) is calculated by multiplying the pivot point by 2 and subtracting the previous day’s high.
- S1 = (2 * PP) — Previous Day’s High
Resistance Level 2 (R2) and Support Level 2 (S2):
- The second resistance level (R2) is calculated by adding the previous day’s high to the difference between the pivot point and the previous day’s low.
- R2 = PP + (Previous Day’s High — Previous Day’s Low)
- The second support level (S2) is calculated by subtracting the difference between the pivot point and the previous day’s high from the pivot point.
- S2 = PP — (Previous Day’s High — Previous Day’s Low)
Resistance Level 3 (R3) and Support Level 3 (S3):
- The third resistance level (R3) is calculated by adding the previous day’s high to twice the difference between the pivot point and the previous day’s low.
- R3 = PP + 2 * (Previous Day’s High — Previous Day’s Low)
- The third support level (S3) is calculated by subtracting twice the difference between the pivot point and the previous day’s high from the pivot point.
- S3 = PP — 2 * (Previous Day’s High — Previous Day’s Low)
How Pivot Points Act as Key Support and Resistance Levels:
- Pivot points are essential because they represent potential turning points in the market. When the price is above the pivot point, it indicates a bullish bias, and when it’s below, it indicates a bearish bias.
- The first support (S1) and resistance (R1) levels are considered minor levels, while the second (S2, R2) and third (S3, R3) levels are considered more significant.
- Traders use pivot points to identify support and resistance levels, helping them decide where to enter or exit trades. For example, a trader might buy at a support level or sell at a resistance level.
- Pivot points also act as breakout points. If the price breaks above a resistance level, it may signal a bullish breakout, while a break below a support level may indicate a bearish breakout.
- Additionally, pivot points can be used to set stop-loss and take-profit levels, allowing traders to manage their risk and optimize their reward-to-risk ratio.
Overall, pivot points are valuable tools for traders as they provide a framework for understanding market sentiment, identifying key levels, and making trading decisions based on the interaction of price with these levels.
Entry and Exit Strategies for Long and Short Trades
Steps for entering a long trade using pivot points, support levels, and ATR-based take-profit and stop-loss levels:
Long Entry:
long_S1 = (
(dataframe[‘volume’] > dataframe[‘volume_mean_10’]) & # Make sure Volume is not 0
(dataframe[‘close’].shift(1) > dataframe[‘close’]) &
((dataframe[‘close’] > dataframe[‘Support1’])) &
((dataframe[‘low’] < dataframe[‘Support1’])) &
((dataframe[‘close’] < dataframe[‘open’])) &
((dataframe[‘open’] — dataframe[‘close’] < dataframe[‘close’] — dataframe[‘low’]))
)
- Same for Support 2–5 too for taking long positions on reversal from Support lines.
Take Profit for Long(TP_L) and StopLoss for Long(SL_L):
dataframe[‘sl_l’] = dataframe[‘close’].shift(1) — (dataframe[‘atr’]*self.sl_l_period.value)
dataframe[‘tp_l’] = dataframe[‘close’].shift(1) + (dataframe[‘atr’]*self.tp_l_period.value)
Steps for entering a short trade using pivot points, resistance levels, and ATR-based take-profit and stop-loss levels:
Short Trade Entry:
short_R1 = (
(dataframe[‘volume’] > dataframe[‘volume_mean_10’]) & # Make sure Volume is not 0
(dataframe[‘close’].shift(1) < dataframe[‘close’]) &
((dataframe[‘high’] > dataframe[‘Resistance1’])) &
((dataframe[‘close’] < dataframe[‘Resistance1’])) &
((dataframe[‘close’] > dataframe[‘open’])) &
((dataframe[‘close’] — dataframe[‘open’] < dataframe[‘high’] — dataframe[‘close’]))
)
- Same for Resistance 2–5 too for taking Short positions on reversal from Support lines.
Take Profit for Short(TP_S) and StopLoss for Short(SL_S):
dataframe[‘sl_s’] = dataframe[‘close’].shift(1) + (dataframe[‘atr’]*self.sl_s_period.value)
dataframe[‘tp_s’] = dataframe[‘close’].shift(1) — (dataframe[‘atr’]*self.tp_s_period.value)
Backtesting a trading strategy with freqtrade
Backtesting is the process of simulating trades using historical market data to evaluate the performance of a trading strategy. Freqtrade includes a backtesting feature that allows users to backtest their trading strategies by specifying a range of dates and a set of market data to use in the simulation.
To backtest a trading strategy with freqtrade, you will need to follow these steps:
- Create a configuration file: Freqtrade requires a configuration file to specify the details of your crypto futures exchange account and your desired trading parameters. To create a configuration file, copy the sample configuration file provided in the freqtrade repository to a new file called “config.json”. Then, edit the file to specify your exchange credentials and desired trading parameters.
- Prepare your market data: Freqtrade requires a set of market data to use in the backtest. This data should be in the form of a CSV file with columns for the date, open price, high price, low price, close price, and volume of the asset being traded. You can obtain this data from a variety of sources, such as a cryptocurrency exchange or a market data provider.
- Run the backtest: Once you have your configuration file and market data ready, you can run the backtest by executing the following command:
freqtrade backtesting --config config.json --strategy MyStrategy --datadir data/Replace “MyStrategy” with the name of your strategy function and “data/” with the directory where your market data is stored. This will run the backtest using the settings specified in your configuration file and the market data provided.
- Review the results: Once the backtest is complete, freqtrade will generate a report with information on the performance of your strategy. This report will include metrics such as the profit/loss, the number of trades executed, and the win/loss ratio of the strategy. You can use this information to evaluate the performance of your strategy and make any necessary adjustments.

You can find the whole code here — https://patreon.com/pppicasso
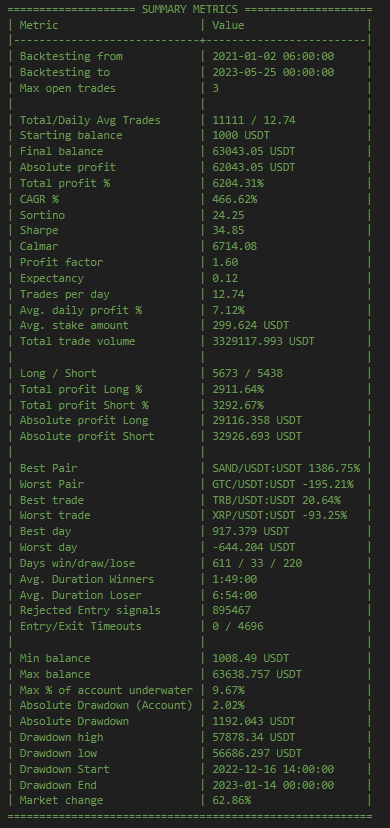
By investing 1000 USDT, (1 USD approximately equal to 1 USDT with 1–2% variance)
for a period of 872 days (from 2021–01–01 07:30:00 up to 2023–05–25 00:00:00)
with maximum open trades at any given point of time being 3
maximum stake in each trade entry being around 300 USDT,
has given a Profit of 6204.31% Profit return on investment (ROI).
The Absolute Draw-down mentioned from results is at — 2.02%
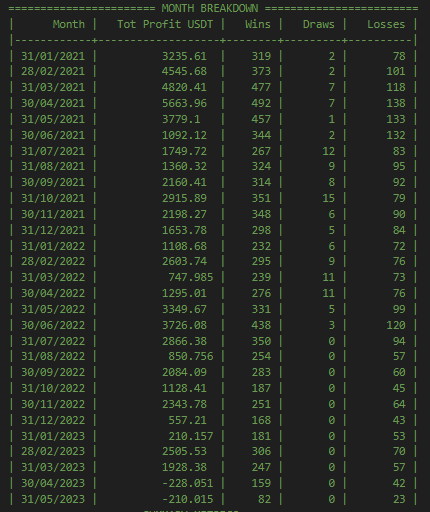
Daily Win to Lose Ratio is at — 611 days of WIN, 220 Days loss and 33 Days of Draw (Open trades which haven’t closed yet)
Average Daily profit is at — 7.12% per day
Daily Average Trades is — 12.74 approximate
Market Returns Have been (if you buy and hold Bitcoin (BTCUSDT) for the above mentioned period the returns are mentioned here, instead of trading) — 62.06%
Time Frame used is 1h
Key Findings from Result:
The algorithm was backtested using historical cryptocurrency price data to evaluate its performance. The following key findings were observed:
- Clear Trading Signals: Price action analysis provides clear and unambiguous signals based on actual price movements, helping traders to make well-informed trading decisions.
- Real-time Market Information: Price action analysis offers real-time insights into market dynamics, enabling traders to react quickly to changing conditions and adjust their strategies accordingly.
- No Lagging Indicators: Price action analysis eliminates reliance on lagging indicators, providing a more responsive and dynamic approach to trading, especially in the fast-paced crypto market.
- Trend Identification: Price action helps identify trends, enabling traders to align their positions with prevailing market direction and ride profitable trends.
- Key Levels: Pivot points, support, and resistance levels act as essential reference points, helping traders identify potential reversal and breakout points and make strategic entry and exit decisions.
- Risk Management: ATR is a valuable tool for setting appropriate stop-loss and take-profit levels based on the asset’s volatility, allowing traders to manage risk effectively.
- Improved Timing: By analyzing price action and key levels, traders can time their trades better, increasing the probability of successful trades and optimizing reward-to-risk ratios.
- Versatility: Price action analysis, along with pivot points and support/resistance levels, can be applied to various timeframes and trading styles, making it adaptable to different crypto trading strategies.
- Psychological Discipline: Price action analysis helps traders overcome emotional biases, as decisions are based on objective data rather than subjective opinions.
- Enhanced Profitability: By combining price action analysis with pivot points, support/resistance levels, ATR, take profit, and stop loss, traders can improve their trading strategies, increasing the potential for profitability
Tips for improving the performance of a trading strategy with freqtrade:
Here are a few tips for improving the performance of a trading strategy with freqtrade:
- Use historical data to evaluate your strategy: Before using your strategy in live trading, it’s important to test it using a range of historical market data to see how it performs under different market conditions. Freqtrade includes a backtesting feature that allows you to do this by simulating trades using historical data. By testing your strategy on a variety of data, you can get a better sense of its strengths and weaknesses and make any necessary adjustments.
- Optimize your strategy’s parameters: Many trading strategies have a set of parameters that can be adjusted to optimize their performance. Freqtrade includes a feature called “Hyperopt” that allows you to optimize your strategy’s parameters by searching for the combination that produces the best results. By optimizing your strategy’s parameters, you can improve its performance and increase the chances of success in live trading.
- Test your strategy in different market conditions: Different market conditions can have a big impact on the performance of a trading strategy. To get a better understanding of how your strategy will perform in different conditions, it’s a good idea to test it in a variety of markets, including both bull and bear markets. This will give you a sense of how your strategy behaves under different circumstances and allow you to make any necessary adjustments.
- Monitor your trades and adjust your strategy as needed: As you use your strategy in live trading, it’s important to monitor the performance of your trades and adjust your strategy as needed. This can help you identify any problems or weaknesses in your strategy and make adjustments to improve its performance. Some things you might want to consider when monitoring your trades include:
. The win/loss ratio: This is the percentage of trades that are profitable versus those that are unprofitable. A high win/loss ratio is generally a good sign, but it’s important to keep in mind that past performance is no guarantee of future results.
· The profit/loss: This is the overall gain or loss from your trades. It’s important to pay attention to this metric to see how your strategy is performing over time.
· The drawdown: This is the maximum loss from a series of trades. A high drawdown can indicate that your strategy is taking on too much risk, so it’s important to keep an eye on this metric and adjust your risk management techniques as needed.
By monitoring your trades and adjusting your strategy as needed, you can improve the performance of your strategy and increase your chances of success in the market.
5. Usage of different time period candle sticks and advantages: Candlestick charts are a type of chart that is commonly used in technical analysis to visualize the price action of an asset over time. Each candlestick on the chart represents a specific time period, and the chart is composed of a series of these candlesticks. The time period for each candlestick can vary, with common periods being 1 minute, 5 minutes, 15 minutes, 30 minutes, 1 hour, 4 hours, and 1 day.
The choice of time period for the candlesticks can have a big impact on the appearance and interpretation of the chart. For example, a chart with 1-minute candlesticks will show a lot of detail and may be more suited for short-term trading, while a chart with 4-hour candlesticks will show less detail and may be more suited for longer-term trading.
There are a few advantages to using different time periods for candlesticks:
- It allows you to see different time frames: By using different time periods, you can view the same asset at different time frames and get a sense of how it is performing over different time horizons. This can be useful for traders who are looking to trade at different scales, such as scalping, day trading, or swing trading.
- It can help you identify trends: Different time periods can reveal different trends in the market. For example, a chart with 1-minute candlesticks may show a lot of short-term fluctuations, while a chart with 4-hour candlesticks may show longer-term trends. By looking at different time periods, you can get a better sense of the overall direction of the market and identify trends that may not be apparent on other time frames.
- It can help you manage risk: By using different time periods, you can tailor your risk management to the time frame you are trading. For example, if you are trading at a short-term time frame, you may want to use a tighter stop loss to protect against rapid price movements, while if you are trading at a longer-term time frame, you may be able to use a wider stop loss without increasing your risk.
While doing forward testing, it is crucial to monitor results for every 100 trades. How many profit to loss trades happened, what is winning %, what is the maximum draw down that happened. While creating a strategy, total Maximum Number of trades and Maximum amount to enter a trade has to be clear. Also, test your strategy on multiple timeframes from 1m, 5m, 15m, 30m, 1h, 4h, 12h, 1d time frames. This will give you overall idea of how your strategy works at different time intervals. Keep optimizing your strategy till you get profits for 500+ trades, also run dry run tests for 2 months before confirming if your strategy is profitable or not.
Overall, using different time periods for candlesticks can be a useful tool for traders who want to analyze and trade the market at different scales. It’s important to experiment with different time periods and find the one that works best for your trading style and goals.
Conclusion:
The backtested results of the cryptocurrency trading algorithm demonstrated promising performance, showcasing its potential for generating profits in the cryptocurrency markets.
In conclusion, price action analysis, along with pivot points, support and resistance levels, ATR, take profit, and stop loss, forms a robust framework for crypto trading. These tools provide valuable insights into market sentiment, trends, volatility, and risk management, empowering traders to navigate the crypto market with greater precision and success.
It’s important to note that past performance does not guarantee future results, and continuous monitoring and optimization of the algorithm are essential to adapt to changing market conditions. Additionally, it is crucial to exercise proper risk management and conduct thorough testing before deploying the algorithm with real funds.
Thank you, Readers.
I hope you have found this article on crypto strategy to be informative and helpful. As a creator, I am dedicated to providing valuable insights and analysis on cryptocurrency, stock market and other assets management.
If you have enjoyed this article and would like to support my ongoing efforts, I would be honored to have you as a member of my Patreon community. As a member, you will have access to exclusive content, early access to new analysis, and the opportunity to be a part of shaping the direction of my research.
Membership starts at just $10, and you can choose to contribute on a bi-monthly basis. Your support will help me to continue to produce high-quality content and bring you the latest insights on financial analytics.
Patreon — https://patreon.com/pppicasso
Regards,
Puranam Pradeep Picasso
Linkedin — https://www.linkedin.com/in/puranampradeeppicasso/
Patreon — https://patreon.com/pppicasso
Facebook — https://www.facebook.com/puranam.p.picasso/
Twitter — https://twitter.com/picasso_999